Enhanced Invocation-level Insights for Bazel Builds
In recent weeks, we’ve added several powerful enhancements to EngFlow’s Build and Test UI to bring you deeper invocation-level insights. These improvements make it easier than ever to identify and diagnose slow or cache-inefficient actions, enabling you to optimize faster and get the most out of your Remote Execution setup.
Cache performance insights
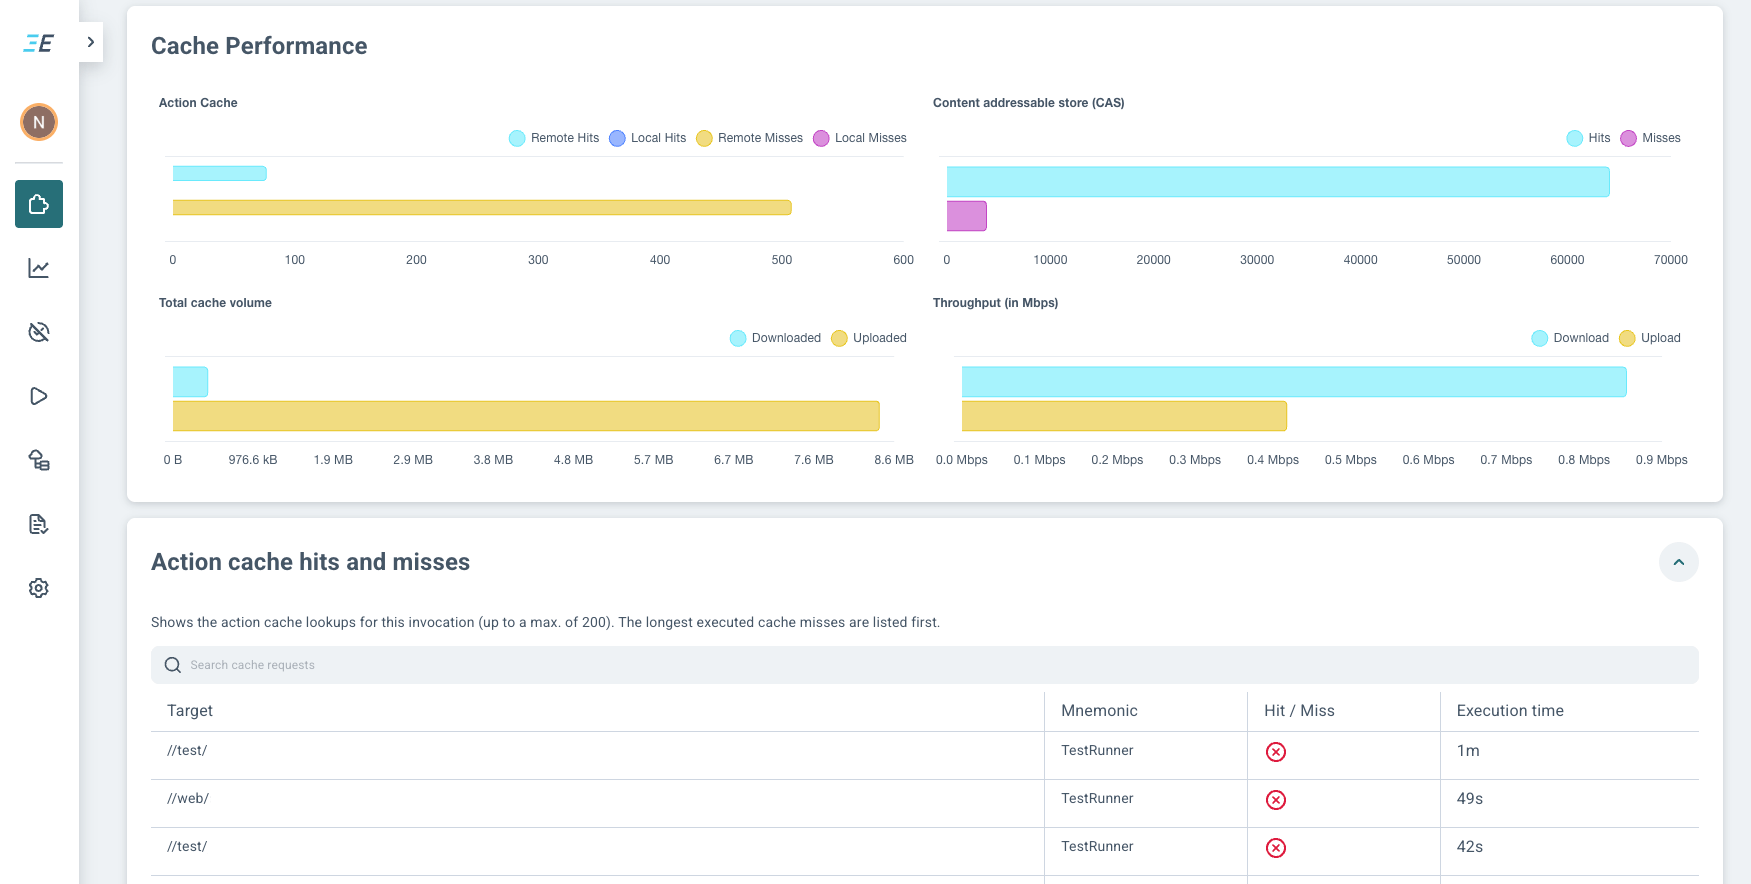
The EngFlow profile has always shown cache hits and misses for an invocation, but now we've removed the need to manually sift through complex logs to isolate remote caching issues. With the new cache performance charts in the Invocation details > Performance tab, you can see cache hits and misses separated by Action Cache and Content Addressable Storage (CAS).
Also new to the Performance tab is a searchable table of 200 action cache lookups in an invocation. If an invocation has action cache misses, the table lists the longest-running actions with misses first, followed by remaining misses, and finally cache hits. To investigate a specific action, click on the entry in the table to bring up the Action details page. Focusing your build optimization efforts where they matter most has never been easier!
Pinpoint longest-running actions
Successful build and test runs often still contain hidden opportunities for faster execution. Even when an invocation finishes cleanly, some actions could be optimized to execute faster.
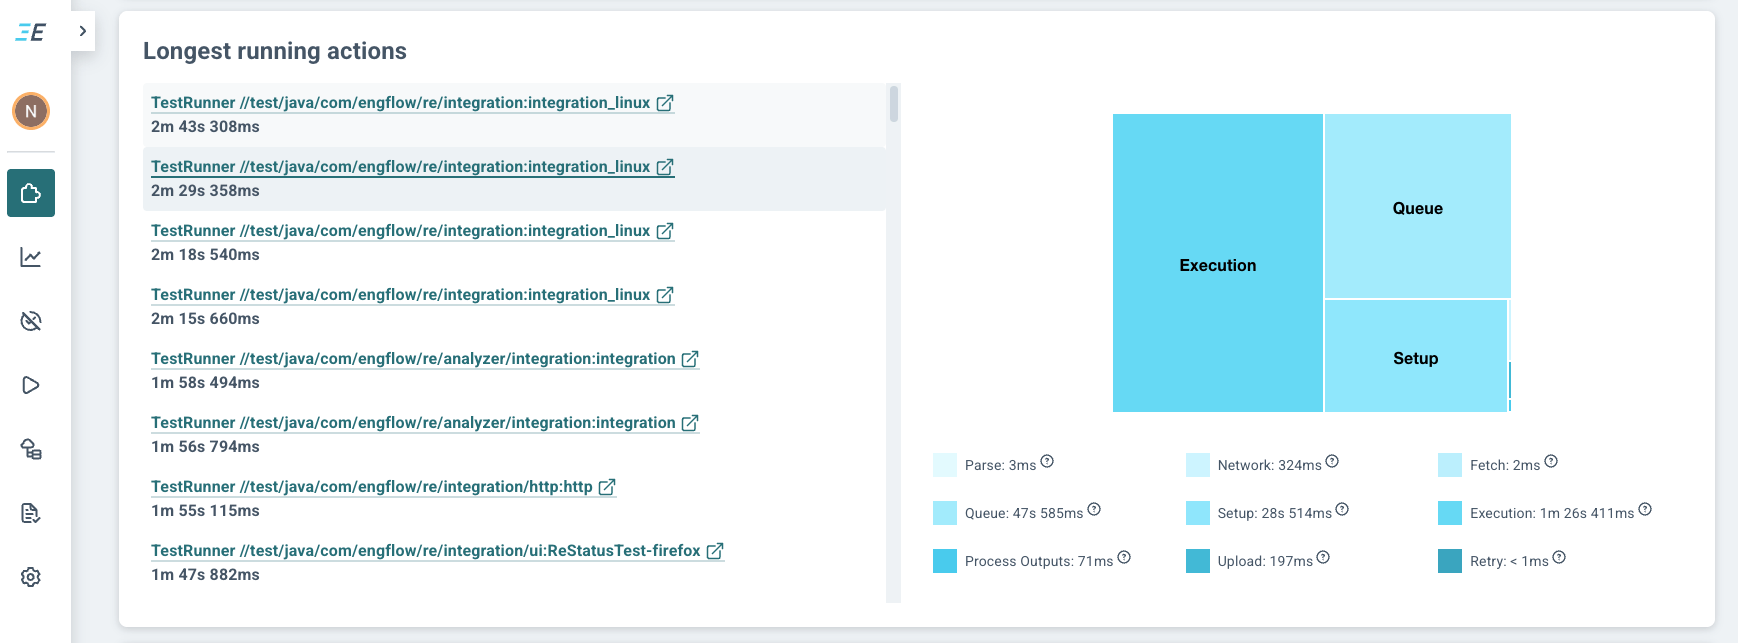
For successful invocations, the Invocation details > Highlights tab pulls together a list of the longest-running actions. You can now see a visual execution time breakdown for each action showing precisely which stage took the longest to finish. For example, you can quickly see the proportional time for an action to fetch inputs, wait in queues, or execute and upload outputs.
Optimize remotely executed actions
The Invocation details > Actions tab now displays a searchable list of the 200 longest-running remotely executed actions across targets in the invocation, along with the time taken for each one. Click into any action to see the Action details page. These pages contain all the necessary data for precision tuning, including the full execution command, the input tree, detailed process statistics, and pressure stall information - everything you need to reduce or eliminate bottlenecks.
Putting troubleshooting front and center
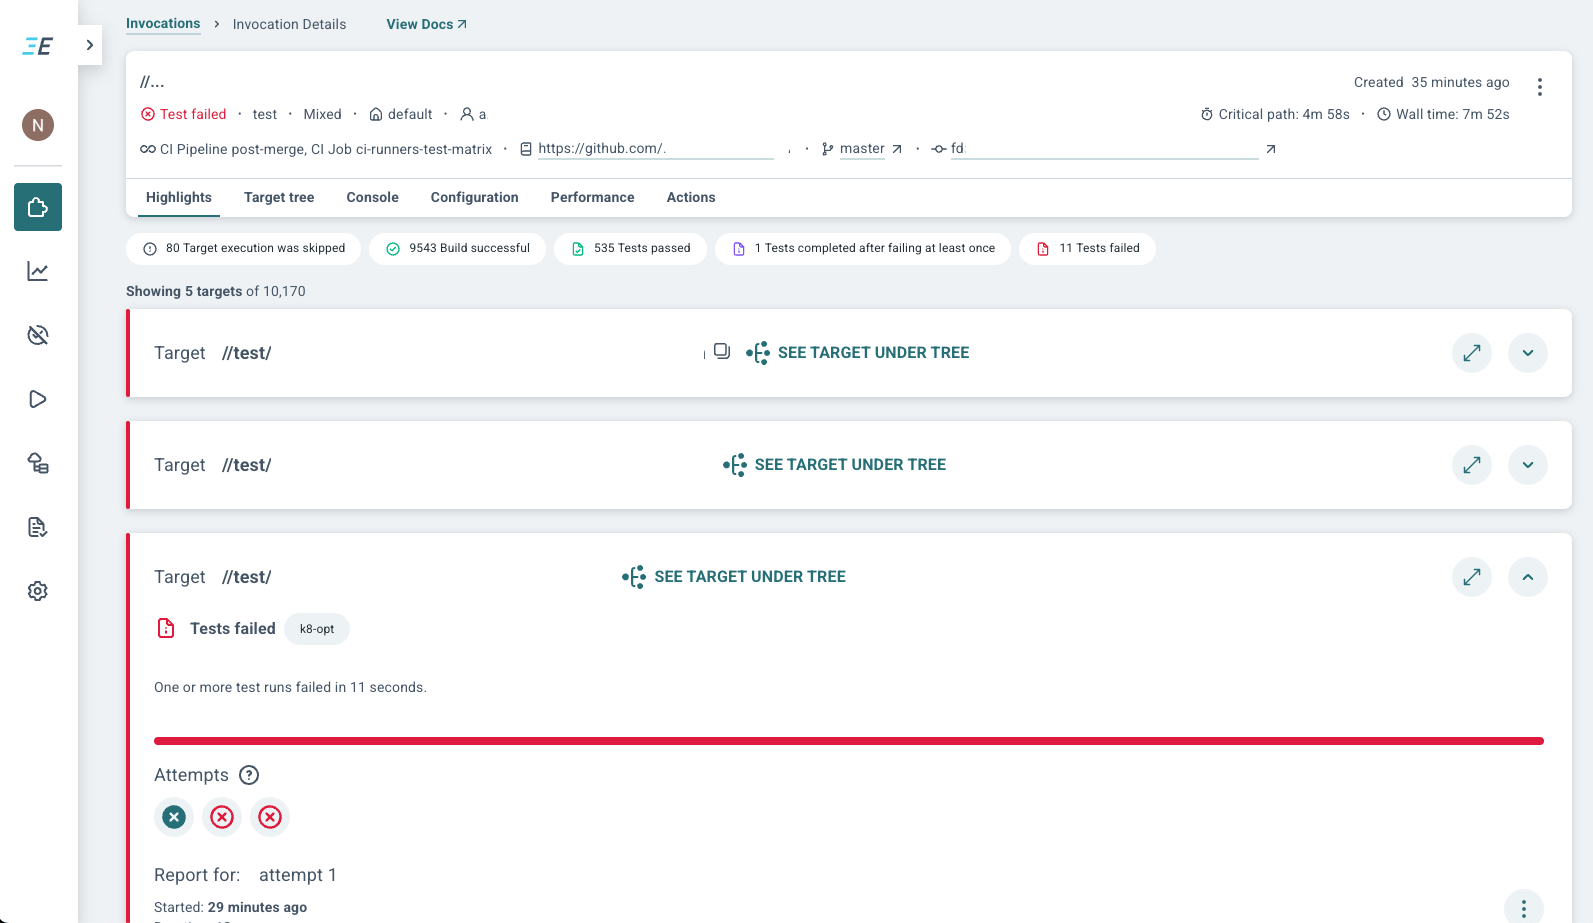
When an invocation has targets that failed to execute, you can now get to the logs right in the Invocation details > Highlights tab with a single click. The action execution status in each log entry presents build or test failure details at a glance. To investigate further, jump into the corresponding Action details page to see the command that was run, the action result and more.
Unlocking deeper insights: Prepare your Bazel workspace
Enhanced invocation-level insights are drawn from the execution logs generated and uploaded during a Bazel build. To use the full range of enhanced insights, ensure your Bazel workspace is properly set up with these flags in your .bazelrc file:
| .bazelrc | |
|---|---|
Tip
- The
--execution_log_compact_fileoption is stable and supported from Bazel 7.4.0 onwards. - Be sure not to set the
--experimental_build_event_upload_strategyoption tolocal. This will result in build events not being uploaded.
Want to learn more about these features or wondering how you can enable them in your UI? Drop us a message and we'll be in touch!